
FROGS Core
Galaxy
- Get Started ▾
- Reads processing
- Remove chimera
- Cluster/ASV filters
- Taxonomic affiliation
- Phylogenetic tree building
- ITSx
- Read demultiplexing
- Affiliatio filters
- Affiliation postprocessing
- Abundance normalisation
- Convert Biom file to TSV file
- Convert TSV file to Biom file
- Cluster/ASV report
- Affiliation report
Main tools
Optional tools
CLI
- Get Started
- Reads processing
- Remove chimera
- Cluster/ASV filters
- Taxonomic affiliation
- Phylogenetic tree building
- ITSx
- Read demultiplexing
- Affiliation filters
- Affiliation postprocessing
- Abundance normalisation
- Convert Biom file to TSV file
- Convert TSV file to Biom file
- Cluster/ASV report
- Affiliation report
Main tools
Optional tools
Cluster filters
Context
Once the clusters have been reconstructed, it is absolutely essential to filter these data.
Most software do this internally without the user being aware of it, but in FROGS this is a user controlled step.
How it does
This tool deletes clusters among conditions enter by user. If an cluster reply to at least 1 criteria, the cluster is deleted.
This tool filters the clusters inside an abundance table according to:
This tool filters the clusters inside an abundance table according to:
- Filter on prevalence
The number of times the cluster is present in the environment, i.e. the number of samples where the cluster must be present. - Filter on abundance
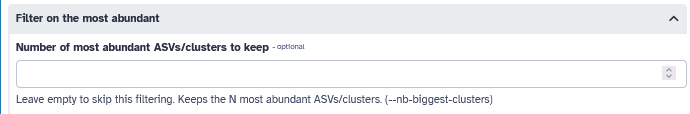
An cluster that is not large enough for a given proportion or count will be removed. - Filter on the most abundant
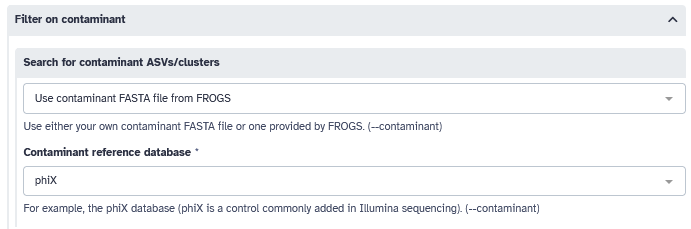
Only the N biggest clusters are conserved. - Filter on contaminant
from the list of proposition, if cluster sequence matches with phiX (a control added in Illumina sequencing technologies), chloroplastic/mitochondrial 16S of A. Thaliana
or your own contaminant sequence (a fasta file containing a list of contaminant of your choice).
Configuration: Short reads (16S V3V4 use cases)
Here are the answers for this dataset:
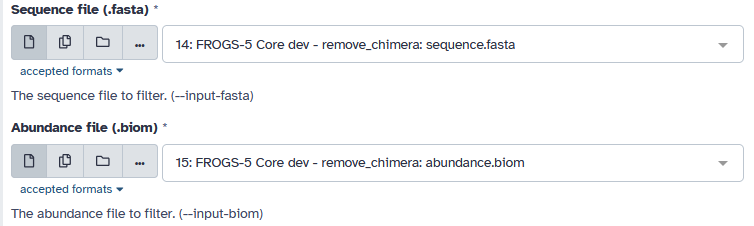
This tool is typically used after Remove chimera. Files are detected automatically, please verify that these are the correct files.
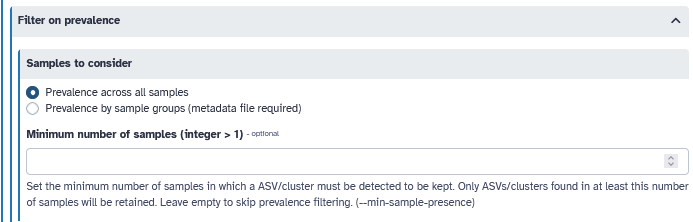
In this example, we did not choose a prevalence filter.
In this example, we did not use most abundant filter.
We use the contaminant filter with the
Don't forget to click on the button :
- Filter on prevalence
- No
- Yes
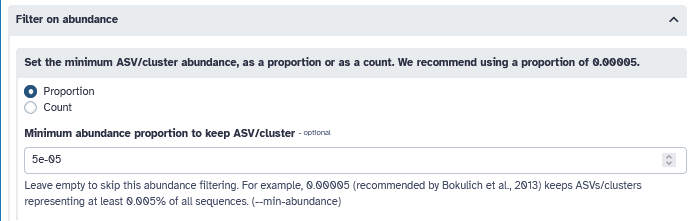
- Filter on abundance
- No
- Yes, 0.00005 (recommended by Bokulich et al., 2013)
- Filter on the most abundant
- No
- Yes
- Filter on contaminant
- No
- Yes, phiX (a control added in Illumina sequencing technologies)
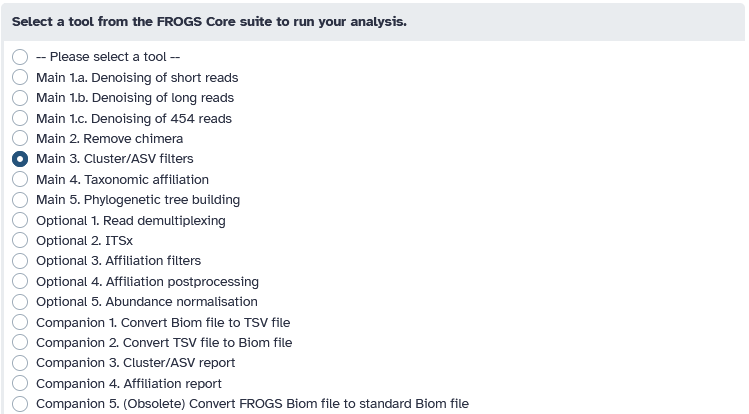
Main 3. Cluster/ASV filters tool.
This tool is typically used after Remove chimera. Files are detected automatically, please verify that these are the correct files.
In this example, we did not choose a prevalence filter.
0.00005 is used as the minimum abundance proportion to keep ASV/cluster, as recommended by Bokulich et al., 2013.
In this example, we did not use most abundant filter.
We use the contaminant filter with the
phiX file provided by FROGS.
Don't forget to click on the button :
Interpretation: Short reads (16S V3V4 use cases)
Let look at the HTML file to see the result of cluster filters.
You have four panels: Filters by ASVs, Filters by samples, ASV distribution, and Sample distribution. Here, we will focus primarily on the Summary panel.

Since the ASV distribution and Samples distribution panels are common to multiple tools, a more detailed interpretation with vizualisation of these panels can be found in the Cluster Stat section .
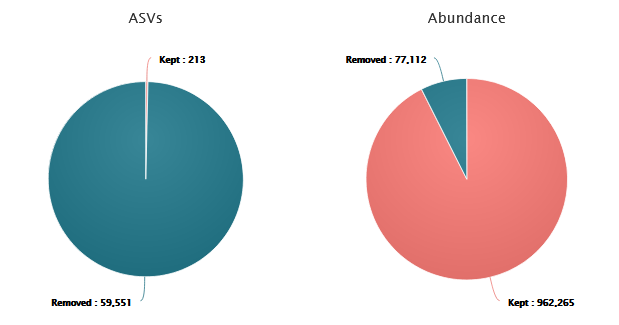
Cluster filters typically remove a significant proportion of ASVs. However, these ASVs do not represent the majority of sequences.
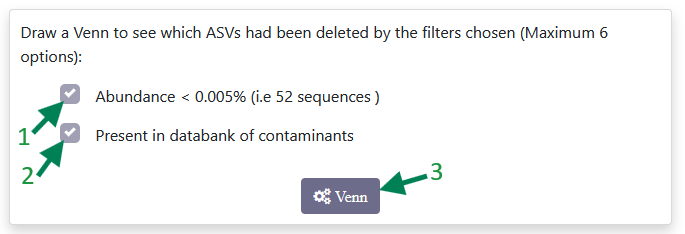
You can see how many sequences have been removed by each filter (1 and 2) separately, or by both filters together, by clicking on Venn diagram (3). This will then display a Venn diagram similar to the one below.
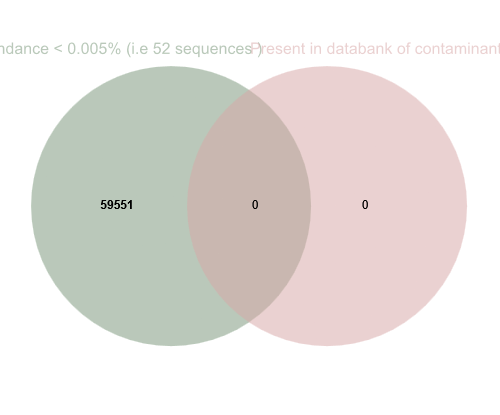 The abundance filter removed all these sequences. There did not appear to be any contaminants in our sequences.
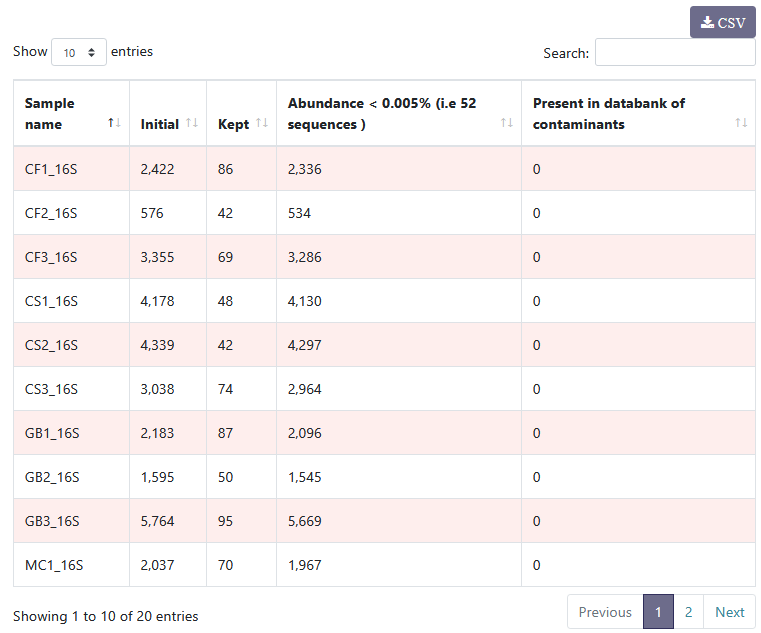
You can see details on filtered clusters within each sample. You can sort the columns by clicking on .
.
For example, if there had been contamination, this table would have enabled us to identify the contaminated samples.
You have four panels: Filters by ASVs, Filters by samples, ASV distribution, and Sample distribution. Here, we will focus primarily on the Summary panel.
Since the ASV distribution and Samples distribution panels are common to multiple tools, a more detailed interpretation with vizualisation of these panels can be found in the Cluster Stat section .
Cluster filters typically remove a significant proportion of ASVs. However, these ASVs do not represent the majority of sequences.
- 99.6% of ASVs are removed, ~7% of sequences are lost but they mostly correspond to low-abundances clusters
- 213 clusters are kept!
- 962,265 sequences are remaining
You can see how many sequences have been removed by each filter (1 and 2) separately, or by both filters together, by clicking on Venn diagram (3). This will then display a Venn diagram similar to the one below.
Filters by samples
You can see details on filtered clusters within each sample. You can sort the columns by clicking on
. For example, if there had been contamination, this table would have enabled us to identify the contaminated samples.