
FROGS Core
Galaxy
- Get Started ▾
- Reads processing
- Remove chimera
- Cluster/ASV filters
- Taxonomic affiliation
- Phylogenetic tree building
- ITSx
- Read demultiplexing
- Affiliatio filters
- Affiliation postprocessing
- Abundance normalisation
- Convert Biom file to TSV file
- Convert TSV file to Biom file
- Cluster/ASV report
- Affiliation report
Main tools
Optional tools
CLI
- Get Started
- Reads processing
- Remove chimera
- Cluster/ASV filters
- Taxonomic affiliation
- Phylogenetic tree building
- ITSx
- Read demultiplexing
- Affiliation filters
- Affiliation postprocessing
- Abundance normalisation
- Convert Biom file to TSV file
- Convert TSV file to Biom file
- Cluster/ASV report
- Affiliation report
Main tools
Optional tools
Cluster statistics
Context
This is a bioinformatics tool designed to analyze and visualize microbial abundance data from BIOM files.
How it does
The program reads an input BIOM file.
The tool generates visualizations and summary statistics in an HTML report.
This produces Clusters distribution and Samples distribution, which are also present in the HTML for denoising, remove chimera, and cluster filters. Hierarchical clustering can be added to Samples distribution.
This produces Clusters distribution and Samples distribution, which are also present in the HTML for denoising, remove chimera, and cluster filters. Hierarchical clustering can be added to Samples distribution.
Configuration: Short reads (16S V3V4 use cases)
sbatch -J c_stats -o LOGS/cluster_stats.out -e LOGS/cluster_stats.err -c 8 --export=ALL --wrap="module load devel/Miniforge/Miniforge3 && module load bioinfo/FROGS/FROGS-v5.0.2 && cluster_stats.py --input-biom FROGS/denoising_swarm.biom --log-file FROGS/aff_filters.log --html FROGS/cluster_stats.html --hierarchical-clustering && module unload bioinfo/FROGS/FROGS-v5.0.2"
cluster_stats.py --help)
Interpretation: Short reads (16S V3V4 use cases)
Let look at the HTML file to see the result after cluster statistic on denoising result.
This report shows statistics on clusters and a hierarchical clustering of samples.

In the statistical cluster, you have two panels: “Cluster distribution” and “Sample distribution.”
Let's start with “Cluster distribution.”
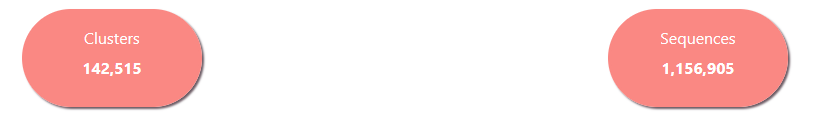 First, you have the number of clusters/ASVs that you obtain after using the denoising tool here, and the number of sequences in all of your samples.
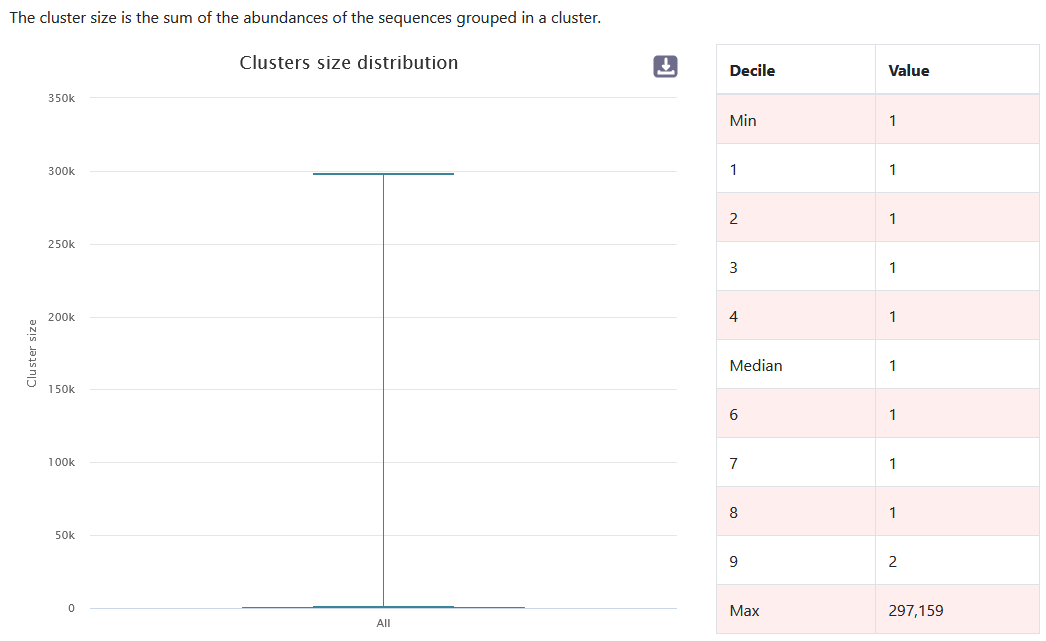
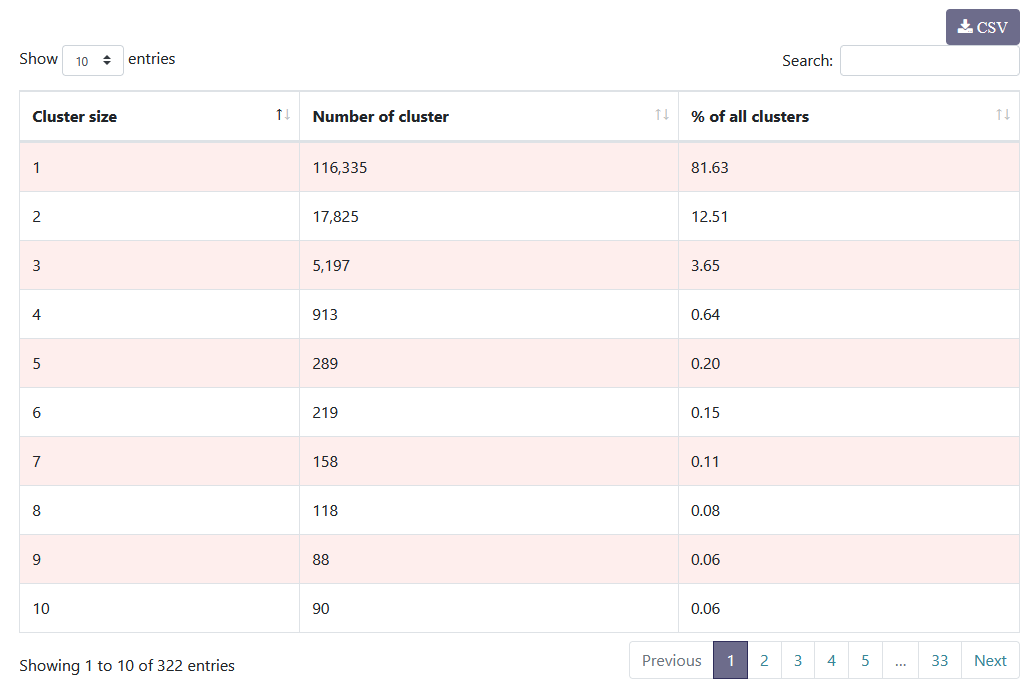
You have information about the distribution of clusters. After denoising, it is normal to obtain a majority of clusters that are formed from only a single sequence.
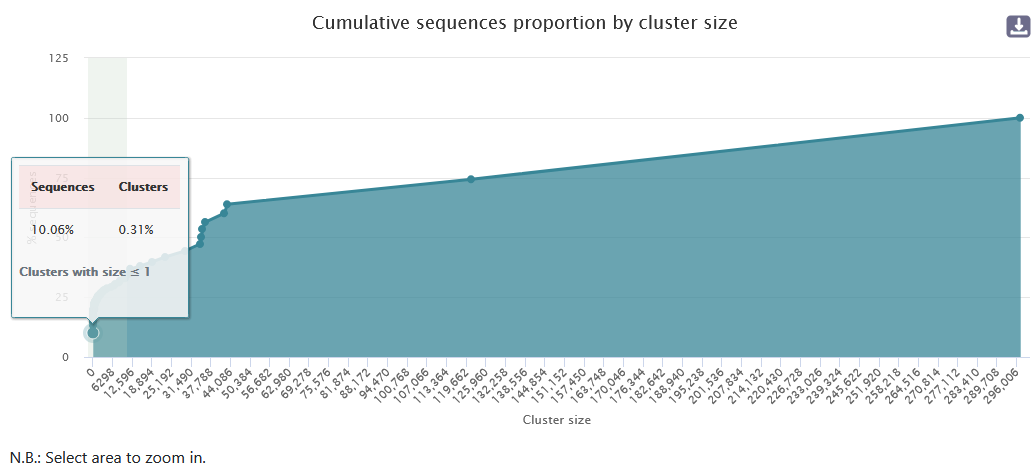 The graph "Cumulative sequences proportion by cluster size" is interactive. You can select an area to zoom in on.
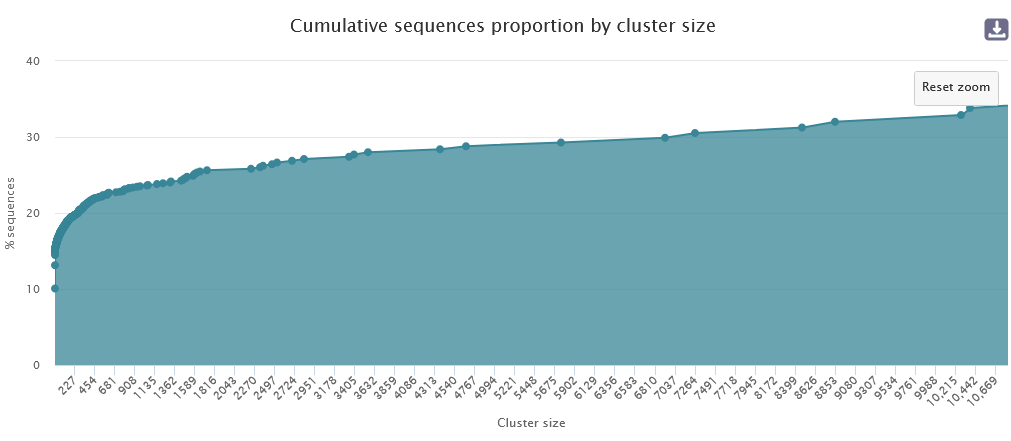
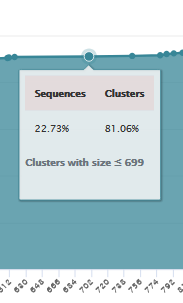
Within this framework, 81.06% of clusters are smaller than or equal to 699, corresponding to 22.73% of the total sequences.
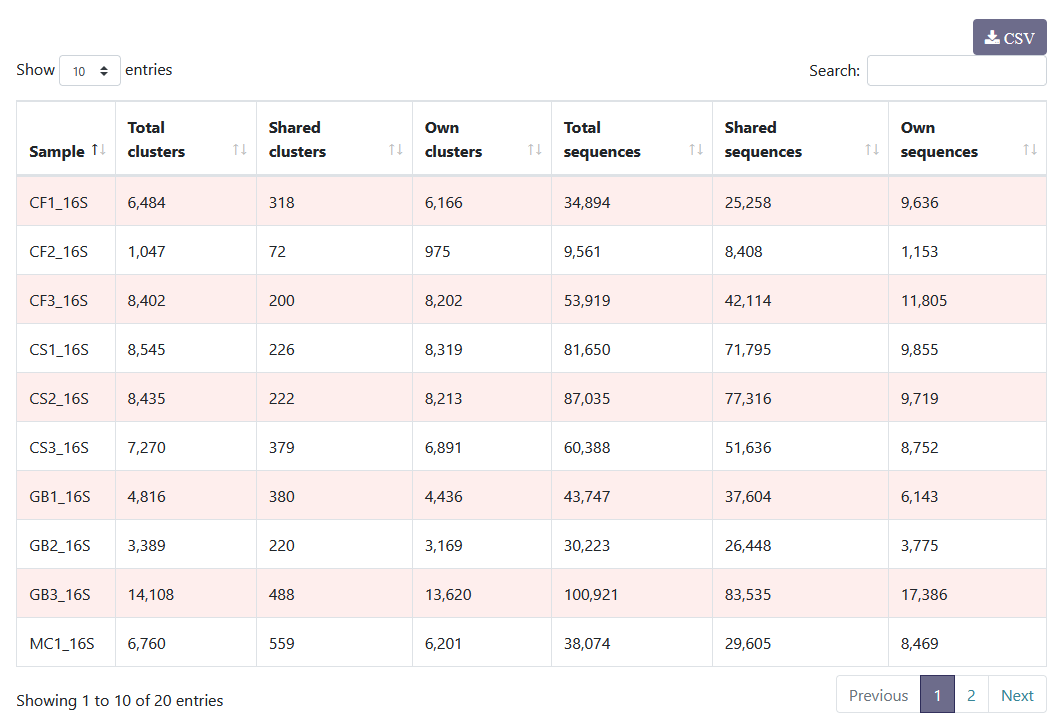 You can see the distribution of clusters and sequences within each sample. You can sort the columns by clicking on
  .
.
Hierarchical clustering
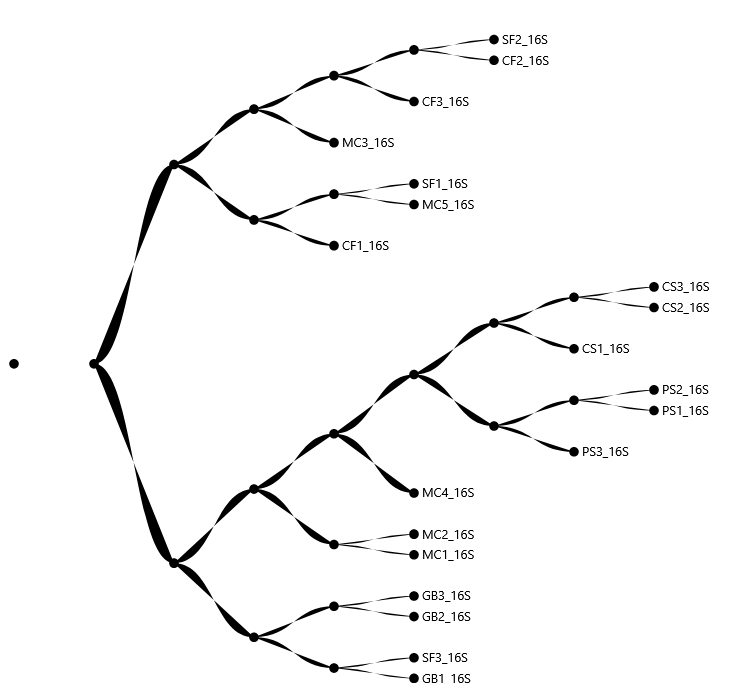
You can only obtain graphs with cluster_stat, and there are other parameters you can use to select the distances between samples.
This report shows statistics on clusters and a hierarchical clustering of samples.
In the statistical cluster, you have two panels: “Cluster distribution” and “Sample distribution.”
Let's start with “Cluster distribution.”
- After denoising, we obtain 142,515 clusters for 1,156,905 sequences.
You have information about the distribution of clusters. After denoising, it is normal to obtain a majority of clusters that are formed from only a single sequence.
- Here, 116,335 clusters are formed from only one sequence.
- This represents 81,63% of clusters.
Within this framework, 81.06% of clusters are smaller than or equal to 699, corresponding to 22.73% of the total sequences.
- Approximately 82% of clusters are size 1, but this represents 10.06% of sequences.
Samples distribution
Sequences count
.
Hierarchical clustering
You can only obtain graphs with cluster_stat, and there are other parameters you can use to select the distances between samples.