
FROGS Core
Galaxy
- Get Started ▾
- Reads processing
- Remove chimera
- Cluster/ASV filters
- Taxonomic affiliation
- Phylogenetic tree building
- ITSx
- Read demultiplexing
- Affiliatio filters
- Affiliation postprocessing
- Abundance normalisation
- Convert Biom file to TSV file
- Convert TSV file to Biom file
- Cluster/ASV report
- Affiliation report
Main tools
Optional tools
CLI
- Get Started
- Reads processing
- Remove chimera
- Cluster/ASV filters
- Taxonomic affiliation
- Phylogenetic tree building
- ITSx
- Read demultiplexing
- Affiliation filters
- Affiliation postprocessing
- Abundance normalisation
- Convert Biom file to TSV file
- Convert TSV file to Biom file
- Cluster/ASV report
- Affiliation report
Main tools
Optional tools
Get Started
Prepare your dataset for FROGS
For your own data, it will be important to know how create an archive .
Install FROGS from conda
Example : Metabarcoding analysis (16S V3V4) with FROGS
The purpose of this post is to show you how to analyze 16S metabarcoding datasets (Illumina 16S V3-V4 region) from the command line with FROGS on the genobioinfo cluster but you can also use FROGS with conda.
The following table gives information on samples, commonly refereed to as metadata and stored in a metadata file .
The following commands will compress and add the expected tag to all files:
This step is crucial. You have to assess the quality of your data to avoid (or at least understand) surprises in results.
It is useful to keep track of the initial number of reads. We can add it to the metadata file:
 Sequencing quality is good. Nothing wrong detected at this step
 The other tabs give information about clusters. They show classical characteristics of clusters built with swarm:
You can use the Krona output to explore the affiliation.
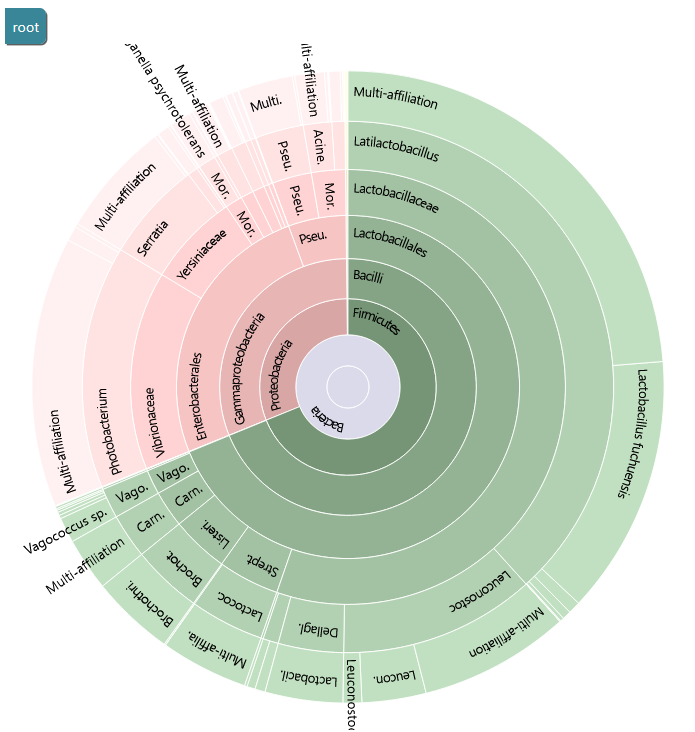
FROGS uses blast tool against a reference databank to assign clusters. Particularly with 16S amplicon data, different species can harbor a similar, or even identical, 16S sequence in the targeted region. This is a very common phenomenon which explains why 16S analyses often do not discriminate between species within the same Genus. FROGS gives you the ability to view the conflicting affiliations of a given cluster. These are called multi-affiliations. Here is an example of a multi-affiliation.
You can use the Krona output to explore the affiliation.
FROGS uses blast tool against a reference databank to assign clusters. Particularly with 16S amplicon data, different species can harbor a similar, or even identical, 16S sequence in the targeted region. This is a very common phenomenon which explains why 16S analyses often do not discriminate between species within the same Genus. FROGS gives you the ability to view the conflicting affiliations of a given cluster. These are called multi-affiliations. Here is an example of a multi-affiliation.
Data
The dataset we will analyze in this post is a part of the samples used in this publication." These are 16S rRNA amplicons of meat and seafood products, as well as synthetic communities, sequenced with the Illumina MiSeq sequencing technology.The following table gives information on samples, commonly refereed to as metadata and stored in a metadata file .
cd ~/work
mkdir -p FROGS_16S/LOGS
cd FROGS_16S
module load bioinfo/SRA-Toolkit/3.0.2
awk '{print "fasterq-dump --split-files --progress --force --outdir . --threads 1", $3}' <(grep SRR metadata.tsv) >> download.sh
bash download.sh
module unload bioinfo/SRA-Toolkit/3.0.2
_R1.fastq and _R2.fastq. Moreoever, sample names are the characters preceeding _R1.fastq and _R2.fastq.
We have to rename files from: SRR7127616_1.fastq and SRR7127616_2.fastq to PS3_16S_R1.fastq and PS3_16S_R2.fastq.
Finally, we can compress them to save disk space.
The following commands will compress and add the expected tag to all files:
for i in *.fastq ; do gzip $i ; mv $i.gz $(echo $i | sed "s/_/_R/" ).gz ; done
awk -F $'\t' '{id = $1 ; oldr1 = $3"_R1.fastq.gz" ; oldr2 = $3"_R2.fastq.gz" ; r1 = id"_R1.fastq.gz" ; r2 = id"_R2.fastq.gz" ; system("mv " oldr1 " " r1 ) ; system("mv " oldr2 " " r2 )}' <(grep SRR metadata.tsv)
Quality control
We can check rapidly if R1 and R2 files have the same number of reads. If not, the files may be corrupted during the download process.This step is crucial. You have to assess the quality of your data to avoid (or at least understand) surprises in results.
for i in *.fastq.gz ; do echo $i $(zcat $i | echo $((`wc -l`/4))) ; done
It is useful to keep track of the initial number of reads. We can add it to the metadata file:
head -n 1 metadata.tsv | tr -d "\n" > header.txt
echo -e "\tReads" >> header.txt
grep SRR metadata.tsv  | sort -k1,1  > file1
awk -F $'\t' '{system("zcat " $1"_R1.fastq.gz | echo $((`wc -l`/4))"  )}' file1 >> reads
cat header.txt <(paste file1 reads) >> metadata2.txt
rm file1 header.txt reads
mkdir FASTQC
sbatch -J fastqc -o LOGS/%x_%j.out -e LOGS/%x_%j.err --wrap="module load bioinfo/FastQC/0.12.1 && fastqc chaillou_data/*.fastq.gz -o FASTQC && module unload bioinfo/FastQC/0.12.1"
mkdir MULTIQC
sbatch -J multiqc -o LOGS/%x_%j.out -e LOGS/%x_%j.err --wrap="module load bioinfo/MultiQC/1.27.1 && multiqc FASTQC -o MULTIQC && module unload bioinfo/MultiQC/1.27.1"
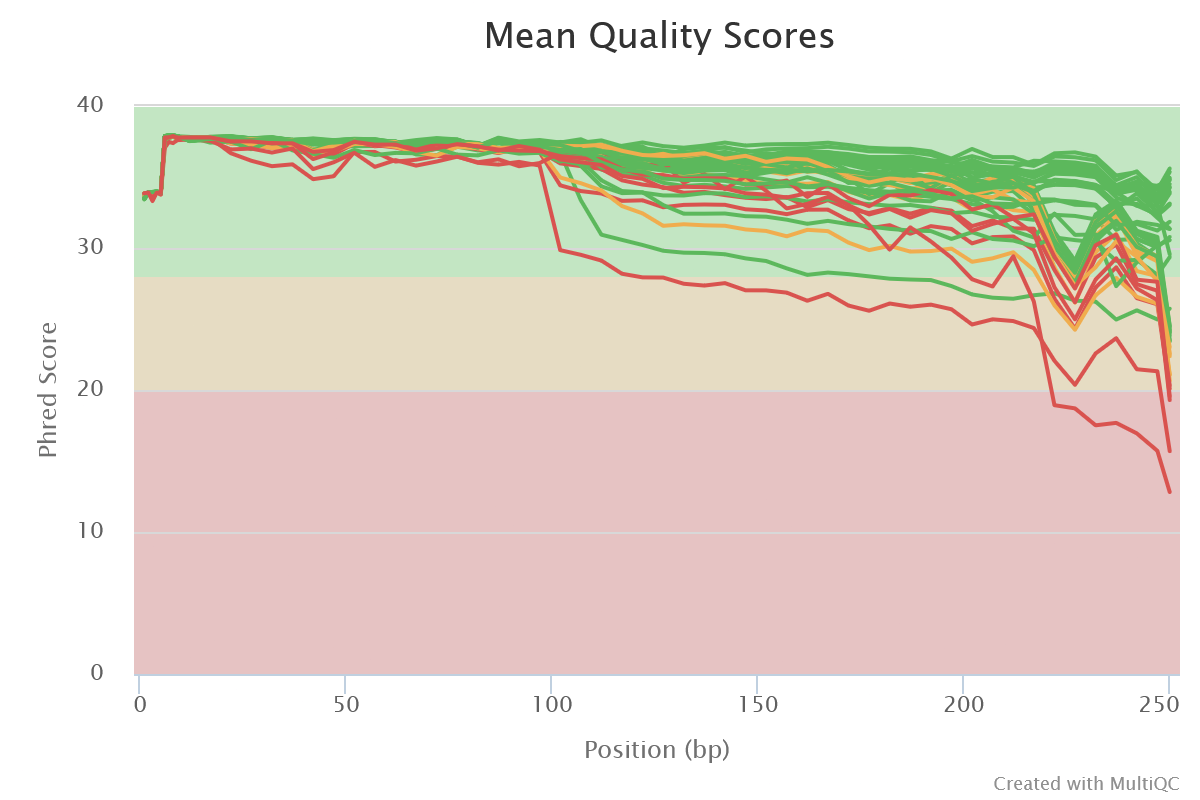
- Sequence Quality Histograms
- Mean quality scores are pretty good. Curve decreases a little more for MC5_R2. But the overlap of R1 and R2 can overcome that.
- All reads are 250 bases long. It indicates that no trimming has been previously performed.
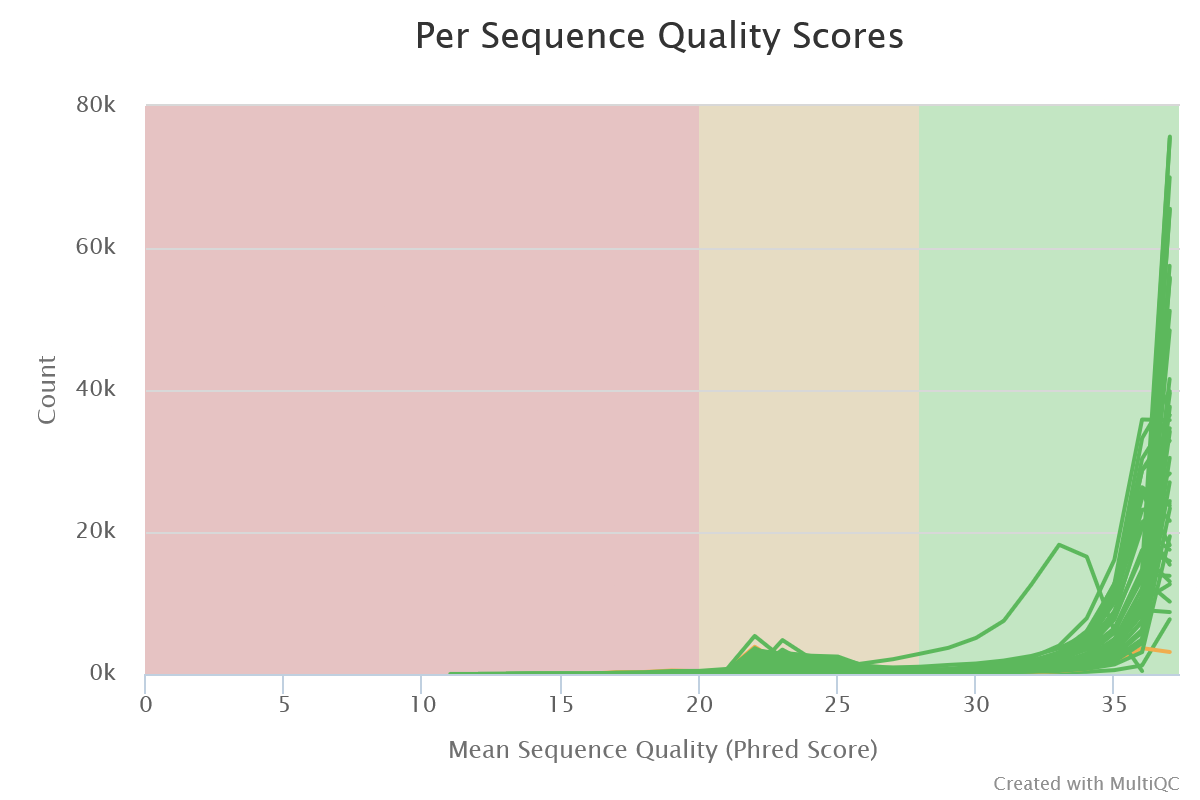
- Per Sequence Quality Scores
- The large majority of reads have a mean quality > 30 (99.9 % of confidence)
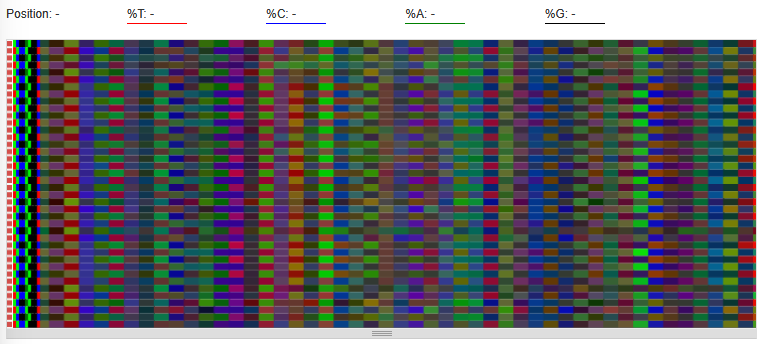
- Per Base Sequence Content
- We can see similar colors for R1 files and for R2 files at the beginning of the reads. They represent the primers.
- Per Sequence GC Content
- Not informative for amplicon data
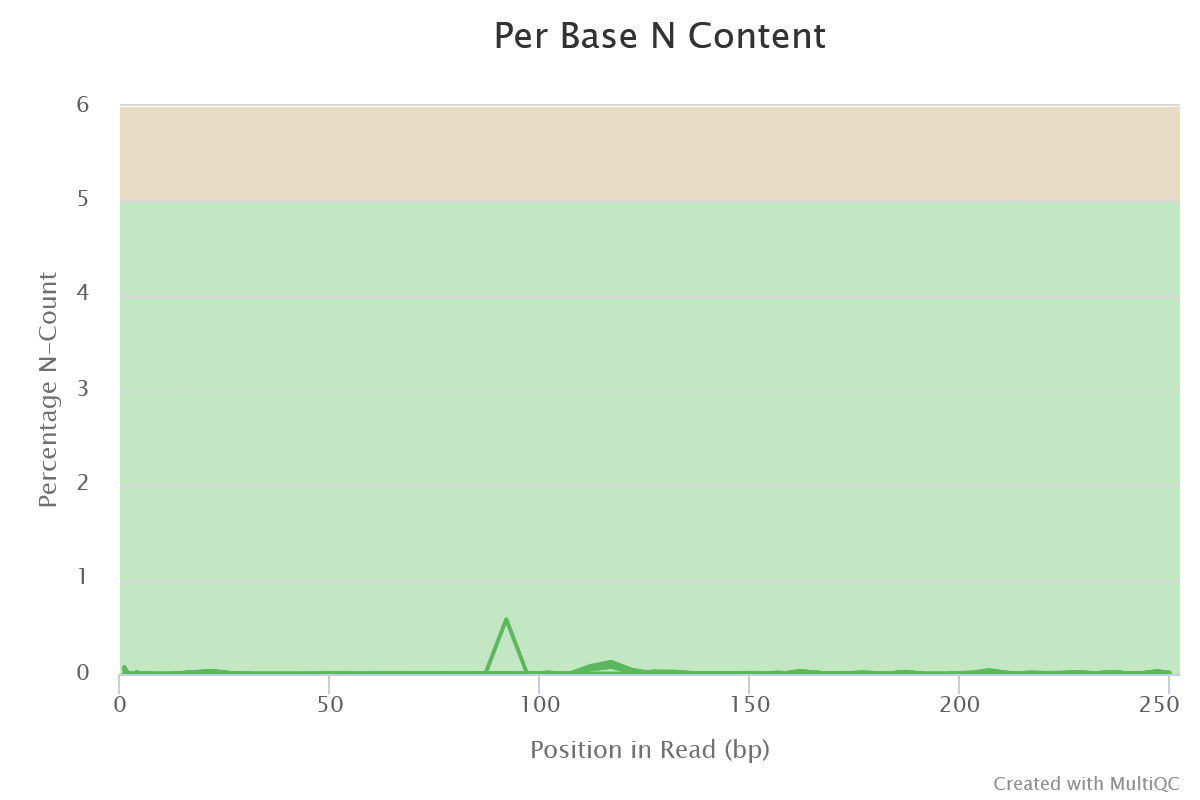
- Per Base N Content
- A small fraction of N bases are still present
- Sequence Length Distribution
- All reads are about 250 bases in size
- Sequence Duplication Levels
- Not informative for amplicon data
- Overrepresented sequences
- Not informative for amplicon data
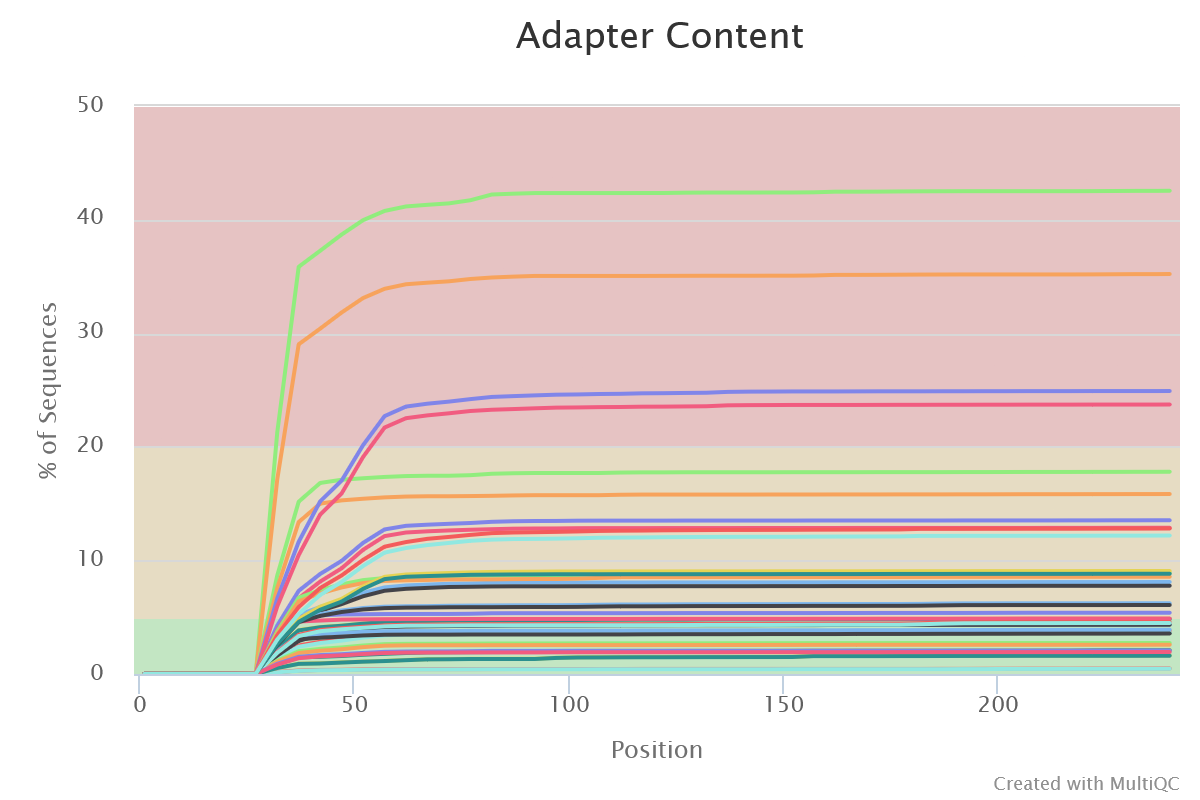
- Adapter Content
- Illumina adapters are present at different levels for all samples. It is representative of small fragments that have been sequenced. Those sequences will be removed later with FROGS.
FROGS
A good practice is to create an archive containing all FASTQ files. It is easier to manipulate than the 40 individual files.tar zcvf data.tar.gz *.fastq.gzrm -f *.fastq.gzReads denoising
The knowledge of your data is essential. You have to answer the following questions to choose the parameters:- Sequencing technology?
- Targeted region and the expected amplicon length?
- Have reads already been merged?
- Have primers already been deleted?
- What are the primers sequences?
- Sequencing technology
- Illumina
- 454
- long reads
- Type of data
- R1 and R2 files for one sample
- One file by sample (R1 and R2 already merged or single-end technology data)
- Amplicon expected length
- Reads are mergeable: V3-V4 region is ~450-bp. So reads should overlap
- Reads are not mergeable
- Reads are are both mergeable and unmergeable
- Primers sequences
- Primers are still present: V3F(5’-ACGGRAGGCWGCAGT-3’) and V4R (5’-TACCAGGGTATCTAATCCT-3’) have been used for the first amplification
- Primers have already been removed
- Reads size
- 250 bp as seen previously
Swarm
mkdir FROGS
sbatch -J denoising -o LOGS/denoising.out -e LOGS/denoising.err -c 8 --export=ALL --wrap="module load devel/Miniforge/Miniforge3 && module load bioinfo/PEAR/0.9.10 && module load bioinfo/FROGS/FROGS-v5.0.2 && denoising.py illumina --input-archive data.tar.gz --min-amplicon-size 200 --max-amplicon-size 490 --merge-software pear --five-prim-primer ACGGRAGGCWGCAGT --three-prim-primer AGGATTAGATACCCTGGTA --R1-size 250 --R2-size 250 --nb-cpus 8 --html FROGS/denoising_swarm.html --log-file FROGS/denoising_swarm.log --output-biom FROGS/denoising_swarm.biom --output-fasta FROGS/denoising_swarm.fasta --process swarm && module unload bioinfo/FROGS/FROGS-v5.0.2"
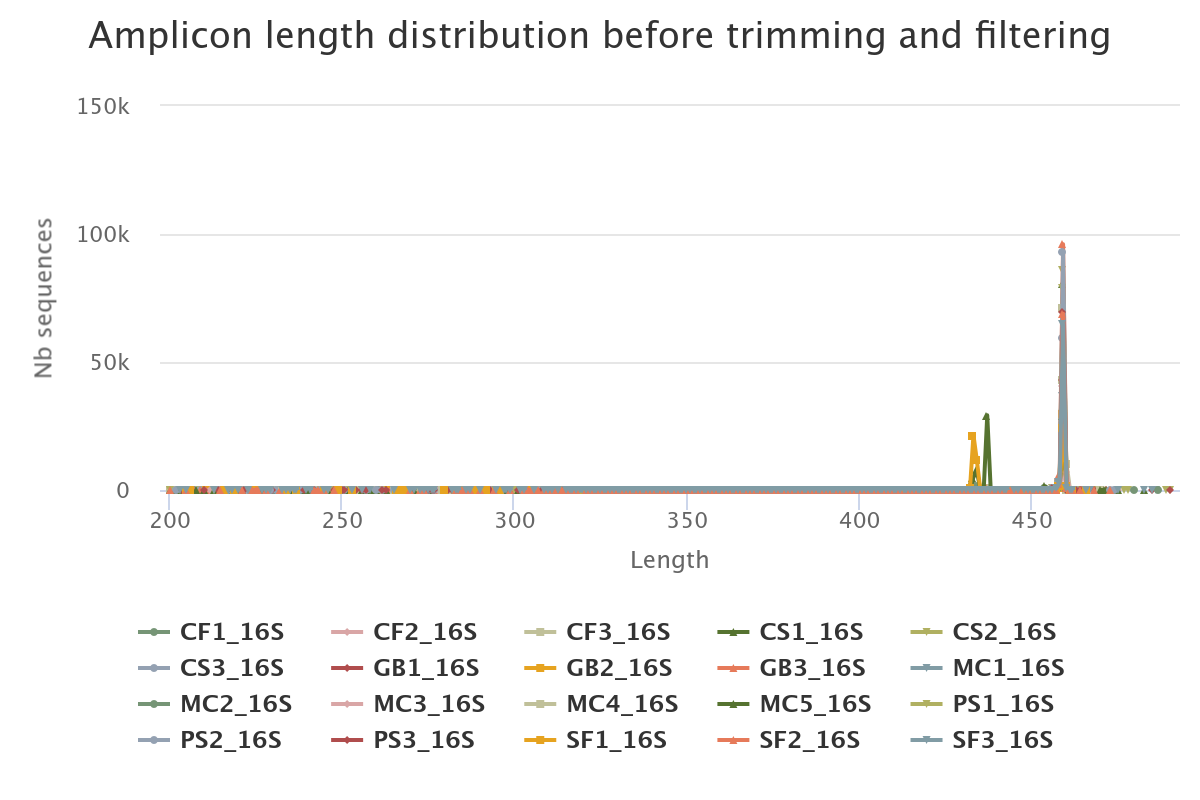
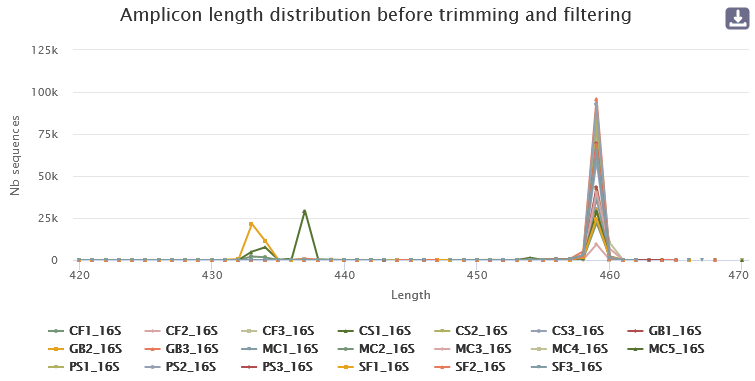
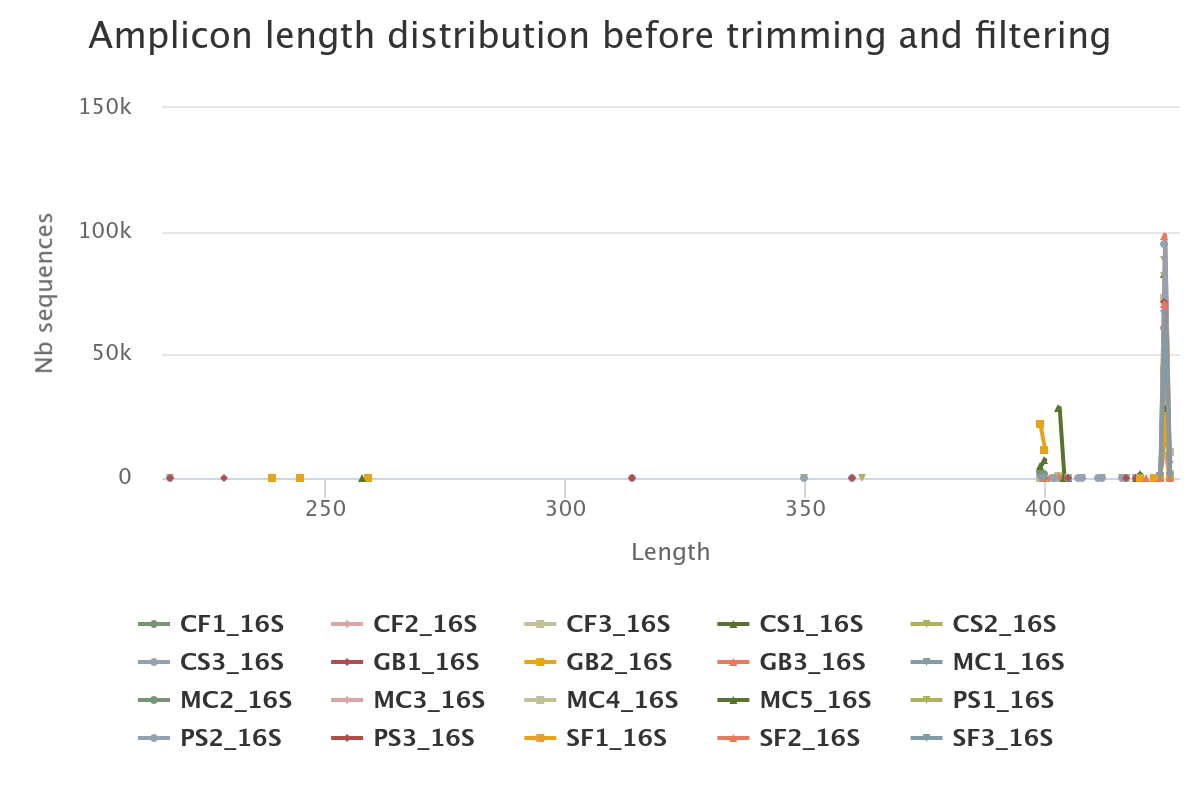
- 89.5% of raw reads are kept (1,229,737 sequences from 1,374,011). No overlap was found for ~9.15% of reads.
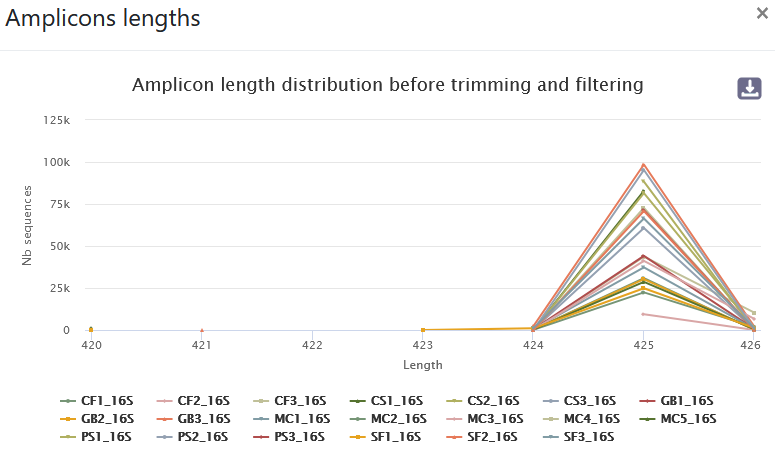
- The length distribution of sequences show that some sequences do not have the expected size. We can run this tool again to increase min amplicon size and reduce max amplicon size.
sbatch -J denoising -o LOGS/denoising.out -e LOGS/denoising.err -c 8 --export=ALL --wrap="module load devel/Miniforge/Miniforge3 && module load bioinfo/PEAR/0.9.10 && module load bioinfo/FROGS/FROGS-v5.0.2 && denoising.py illumina --input-archive data.tar.gz --min-amplicon-size 420 --max-amplicon-size 470 --merge-software pear --five-prim-primer ACGGRAGGCWGCAGT --three-prim-primer AGGATTAGATACCCTGGTA --R1-size 250 --R2-size 250 --nb-cpus 8 --html FROGS/denoising_swarm.html --log-file FROGS/denoising_swarm.log --output-biom FROGS/denoising_swarm.biom --output-fasta FROGS/denoising_swarm.fasta --process swarm && module unload bioinfo/FROGS/FROGS-v5.0.2"
- A lot of clusters: 191,017
- ~86.14% of them are composed of only 1 sequence
Chimera removal
The chimera detection is performed with vsearch.mkdir FROGS/SWARM/
sbatch -J chimera -o LOGS/chimera.out -e LOGS/chimera.err -c 8 --export=ALL --wrap="module load devel/Miniforge/Miniforge3 && module load bioinfo/FROGS/FROGS-v5.0.2 && remove_chimera.py --input-fasta FROGS/denoising_swarm.fasta --input-biom FROGS/denoising_swarm.biom --output-fasta FROGS/SWARM/remove_chimera.fasta --nb-cpus 8 --log-file FROGS/SWARM/remove_chimera.log --output-biom FROGS/SWARM/remove_chimera.biom --html FROGS/SWARM/remove_chimera.html && module unload bioinfo/FROGS/FROGS-v5.0.2"
- ~10% of sequences (19.2% of clusters) are chimeric
- Chimeric clusters are made of few sequences
Cluster Filters : Abundance and prevalence-based filters
We now apply filters to remove low-abundant clusters that are likely to be chimeras or artifacts. We check also if some phiX sequences are still present. Low-abundant clusters are difficult to estimate. Following FROGS guidelines, we choose 0.005% of overall abundance. More stringent filters, including filters based on the prevalence across samples, can be made later if needed.sbatch -J filters -o LOGS/filters.out -e LOGS/filters.err -c 8 --export=ALL --wrap="module load devel/Miniforge/Miniforge3 && module load bioinfo/FROGS/FROGS-v5.0.2 && cluster_filters.py --input-fasta FROGS/SWARM/remove_chimera.fasta --input-biom FROGS/SWARM/remove_chimera.biom --output-fasta FROGS/SWARM/filters.fasta --nb-cpus 8 --log-file FROGS/SWARM/filters.log --output-biom FROGS/SWARM/filters.biom --html FROGS/SWARM/filters.html --excluded FROGS/SWARM/filters_excluded.tsv --contaminant /save/user/frogs/galaxy_databanks/phiX_genome/phi.fa --min-sample-presence 1 --min-abundance 0.00005 && module unload bioinfo/FROGS/FROGS-v5.0.2"
- 153,691 clusters are filtered out; 195 clusters are kept!
- ~16% of sequences are lost but they mostly correspond to low-abundances clusters!
- 928,016 sequences are remaining
Affiliation
It is now time to give our clusters a taxonomic affiliation. We use the most up-to-date available version of Silva (v.138.1) among all databanks available in the dedicated repository:/save/user/frogs/galaxy_databanks/SILVA/16S . In this tutorial, we are using the Silva pintail 100 database, but this is to keep the database small. It may not be the most suitable database for your data.
sbatch -J affiliation -o LOGS/affiliation.out -e LOGS/affiliation.err -c 8 --export=ALL --wrap="module load devel/Miniforge/Miniforge3 && module load bioinfo/FROGS/FROGS-v5.0.2 && taxonomic_affiliation.py --input-fasta FROGS/SWARM/filters.fasta --input-biom FROGS/SWARM/filters.biom --nb-cpus 8 --log-file FROGS/SWARM/affiliation.log --output-biom FROGS/SWARM/affiliation.biom --html FROGS/SWARM/affiliation.html --reference /save/user/frogs/galaxy_databanks/SILVA/16S/silva_138.1_16S_pintail100/silva_138.1_16S_pintail100.fasta && module unload bioinfo/FROGS/FROGS-v5.0.2"
You can use the Krona output to explore the affiliation.
sbatch -J biom_to_tsv -o LOGS/biom_to_tsv.out -e LOGS/biom_to_tsv.err -c 8 --export=ALL --wrap="module load devel/Miniforge/Miniforge3 && module load bioinfo/FROGS/FROGS-v5.0.2 && biom_to_tsv.py --input-biom FROGS/SWARM/affiliation.biom --input-fasta FROGS/SWARM/filters.fasta --output-tsv FROGS/SWARM/affiliation.tsv --output-multi-affi FROGS/SWARM/multi_aff.tsv --log-file FROGS/SWARM/biom_to_tsv.log && module unload bioinfo/FROGS/FROGS-v5.0.2"
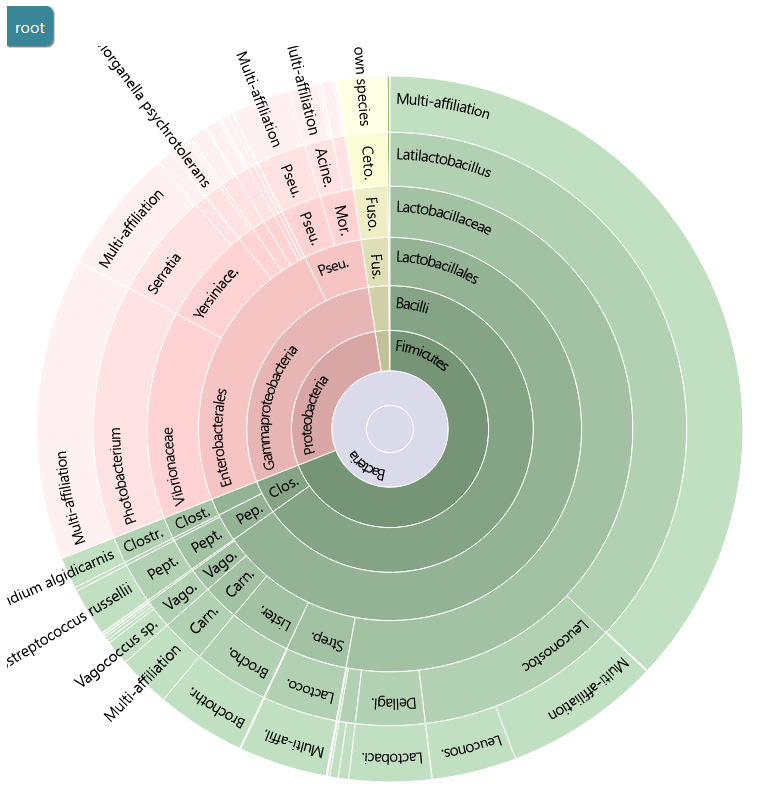
FROGS uses blast tool against a reference databank to assign clusters. Particularly with 16S amplicon data, different species can harbor a similar, or even identical, 16S sequence in the targeted region. This is a very common phenomenon which explains why 16S analyses often do not discriminate between species within the same Genus. FROGS gives you the ability to view the conflicting affiliations of a given cluster. These are called multi-affiliations. Here is an example of a multi-affiliation.
DADA2
sbatch -J denoising -o LOGS/denoising.out -e LOGS/denoising.err -c 8 --export=ALL --wrap="module load devel/Miniforge/Miniforge3 && module load bioinfo/PEAR/0.9.10 && module load bioinfo/FROGS/FROGS-v5.0.2 && denoising.py illumina --input-archive data.tar.gz --min-amplicon-size 200 --max-amplicon-size 490 --merge-software pear --five-prim-primer ACGGRAGGCWGCAGT --three-prim-primer AGGATTAGATACCCTGGTA --R1-size 250 --R2-size 250 --nb-cpus 8 --html FROGS/denoising_dada2.html --log-file FROGS/denoising_dada2.log --output-biom FROGS/denoising_dada2.biom --output-fasta FROGS/denoising_dada2.fasta --process dada2 && module unload bioinfo/FROGS/FROGS-v5.0.2"
- 82.78% of raw reads are kept (1,137,452 sequences from 1,374,011)
- The length distribution of sequences show that some sequences do not have the expected size. We can run this tool again to increase min amplicon size and reduce max amplicon size.
sbatch -J denoising -o LOGS/denoising.out -e LOGS/denoising.err -c 8 --export=ALL --wrap="module load devel/Miniforge/Miniforge3 && module load bioinfo/PEAR/0.9.10 && module load bioinfo/FROGS/FROGS-v5.0.2 && denoising.py illumina --input-archive data.tar.gz --min-amplicon-size 420 --max-amplicon-size 470 --merge-software pear --five-prim-primer ACGGRAGGCWGCAGT --three-prim-primer AGGATTAGATACCCTGGTA --R1-size 250 --R2-size 250 --nb-cpus 8 --html FROGS/denoising_dada2.html --log-file FROGS/denoising_dada2.log --output-biom FROGS/denoising_dada2.biom --output-fasta FROGS/denoising_dada2.fasta --process dada2 && module unload bioinfo/FROGS/FROGS-v5.0.2"
Chimera removal
The chimera detection is performed with vsearch.mkdir FROGS/DADA2/
sbatch -J chimera -o LOGS/chimera.out -e LOGS/chimera.err -c 8 --export=ALL --wrap="module load devel/Miniforge/Miniforge3 && module load bioinfo/FROGS/FROGS-v5.0.2 && remove_chimera.py --input-fasta FROGS/denoising_dada2.fasta --input-biom FROGS/denoising_dada2.biom --output-fasta FROGS/DADA2/remove_chimera.fasta --nb-cpus 8 --log-file FROGS/DADA2/remove_chimera.log --output-biom FROGS/DADA2/remove_chimera.biom --html FROGS/DADA2/remove_chimera.html && module unload bioinfo/FROGS/FROGS-v5.0.2"
- ~10% of sequences (77% of clusters) are chimeric
- Chimeric clusters are made of few sequences
Cluster Filters : Abundance and prevalence-based filters
We now apply filters to remove low-abundant clusters that are likely to be chimeras or artifacts. We check also if some phiX sequences are still present. Low-abundant clusters are difficult to estimate. Following FROGS guidelines, we choose 0.005% of overall abundance. More stringent filters, including filters based on the prevalence across samples, can be made later if needed.sbatch -J filters -o LOGS/filters.out -e LOGS/filters.err -c 8 --export=ALL --wrap="module load devel/Miniforge/Miniforge3 && module load bioinfo/FROGS/FROGS-v5.0.2 && cluster_filters.py --input-fasta FROGS/DADA2/remove_chimera.fasta --input-biom FROGS/DADA2/remove_chimera.biom --output-fasta FROGS/DADA2/filters.fasta --nb-cpus 8 --log-file FROGS/DADA2/filters.log --output-biom FROGS/DADA2/filters.biom --html FROGS/DADA2/filters.html --excluded FROGS/DADA2/filters_excluded.tsv --contaminant /save/user/frogs/galaxy_databanks/phiX_genome/phi.fa --min-sample-presence 1 --min-abundance 0.00005 && module unload bioinfo/FROGS/FROGS-v5.0.2"
- 2,339 clusters are filtered out; 459 clusters are kept!
- ~2% of sequences are lost but they mostly correspond to low-abundances clusters!
- 1,004,211 sequences are remaining
Affiliation
It is now time to give our clusters a taxonomic affiliation. We use the most up-to-date available version of Silva [9] (v.138.1) among all databanks available in the dedicated repository: /db/outils/FROGS/assignation/.sbatch -J affiliation -o LOGS/affiliation.out -e LOGS/affiliation.err -c 8 --export=ALL --wrap="module load devel/Miniforge/Miniforge3 && module load bioinfo/FROGS/FROGS-v5.0.2 && taxonomic_affiliation.py --input-fasta FROGS/DADA2/filters.fasta --input-biom FROGS/DADA2/filters.biom --nb-cpus 8 --log-file FROGS/DADA2/affiliation.log --output-biom FROGS/DADA2/affiliation.biom --html FROGS/DADA2/affiliation.html --reference /save/user/frogs/galaxy_databanks/SILVA/16S/silva_138.1_16S_pintail100/silva_138.1_16S_pintail100.fasta && module unload bioinfo/FROGS/FROGS-v5.0.2"
You can use the Krona output to explore the affiliation.
sbatch -J biom_to_tsv -o LOGS/biom_to_tsv.out -e LOGS/biom_to_tsv.err -c 8 --export=ALL --wrap="module load devel/Miniforge/Miniforge3 && module load bioinfo/FROGS/FROGS-v5.0.2 && biom_to_tsv.py --input-biom FROGS/DADA2/affiliation.biom --input-fasta FROGS/DADA2/filters.fasta --output-tsv FROGS/DADA2/affiliation.tsv --output-multi-affi FROGS/DADA2/multi_aff.tsv --log-file FROGS/DADA2/biom_to_tsv.log && module unload bioinfo/FROGS/FROGS-v5.0.2"
FROGS uses blast tool against a reference databank to assign clusters. Particularly with 16S amplicon data, different species can harbor a similar, or even identical, 16S sequence in the targeted region. This is a very common phenomenon which explains why 16S analyses often do not discriminate between species within the same Genus. FROGS gives you the ability to view the conflicting affiliations of a given cluster. These are called multi-affiliations. Here is an example of a multi-affiliation.